Monitoring slurm jobs
This section describes the techniques for monitoring jobs running through slurm, the amount of resources they are currently using (CPUs, RAM, and GPUs), the overall amount of resources used by completed jobs, and whether jobs have started running, have finished running, or have failed.
Additionally, it is described how to monitor the overall activity level of the cluster, to help inform how many resources you can reasonably reserve for a set of jobs. See the Best practice for reserving resources section.
E-mail notifications on job completion
In addition to actively monitoring your jobs using squeue, it is
possible to receive email notifications when your jobs are started,
finish, fail, are re-queued, or some combination. This is accomplished
by using the --mail-user and --mail-type options:
$ sbatch --mail-user=abc123@ku.dk --mail-type=END,FAIL my_script.sh
Submitted batch job 8503
These options can naturally also be embedded in your sbatch script:
1#!/bin/bash
2#SBATCH --mail-user=abc123@ku.dk --mail-type=END,FAIL
3
4my-commands
and queued as usual:
$ sbatch my-script.sh
Submitted batch job 8504
When these options are enabled, Slurm will send a notification to
abc123@ku.dk account when the job is completed or if it fails. The
possible values for --mail-type are NONE (the default),
BEGIN, END, FAIL, REQUEUE, ALL, or some combination
as shown above.
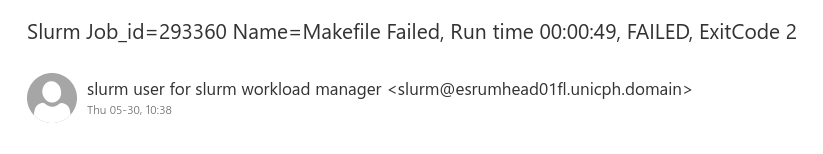
The email contains the ID of the job, the name you specified using
--job-name, the status (e.g. Completed or Failed), how long
it ran (not counting time spent queued), and the return-code of the
script or command:
The Slurm notification emails typically, but not always, arrive instantly.
Warning
Remember to use your own @ku.dk email address as the recipient,
instead of abc123@ku.dk. It is possible to use email addresses
outside @ku.dk, but some providers will silently block the Slurm
emails, and we therefore recommend using your @ku.dk address.
Monitoring overall resource usage by jobs
The sacct command reports detailed statistics about completed jobs,
while the sstat command reports statistics about your running jobs.
Note that sacct, and the script below, can only be run on the head
node.
However, the output from these tools may be difficult to interpret, and for that reason we provide a helper script, sacct-usage, that summarizes some of this information in a more easily readable form.
$ sacct-usage
User    Job   Start                   Elapsed  State      CPUsReserved  CPUsUsed  MemReserved  MemUsed  Name
abc123  1     2025-09-01 10:15:01  252:04:52s  FAILED                8       1.1        124.6    105.9  python3
abc123  2[1]  2025-09-15 16:02:35   02:49:25s  COMPLETED            32      16.3        512.0    358.7  paleomix
abc123  3     2025-09-23 12:35:19   01:00:53s  RUNNING              24      22.6         64.0     16.0  bash
Briefly, sacct-usage reports how many CPUs and how much memory you
reserved for your jobs, and how many CPUs and how much memory your job
actually utilized.
We ask that you please try to keep your CPU and memory reservations in line with the amount of resources your jobs actually use. In particular, do not reserve CPUs that you are not using. However, you do not need to reduce your memory reservations below the default ~16 GB of RAM per CPU, as we consider that the baseline.
Note
Note that the MemUsed values may not be accurate in cases where
processes were killed due to requesting/using excess amounts of
memory. When "out of memory" errors occur, you will have to increase
the amount of memory reserved even though your apparent usage may be
less than your current reservations.
Monitoring individual processes in a job
While sacct can report on the overall resource usage of you job, it
can also be helpful to track resource usage for individual commands that
you are running. This is particularly useful when attempting to optimize
the number of CPUs used commands run in a job.
One way of doing this is via the time command, which can report the
efficiency from using multiple threads and to show how much memory a
program used. This is acoomplished by prepending /usr/bin/time -f "CPU
= %P, MEM = %MKB" to the command that you want to measure, as shown in
this example, where we wish to measure the resource usage of the
my-command program:
$ /usr/bin/time -f "CPU = %P, MEM = %M" my-command --threads 1 ...
CPU = 99%, MEM = 840563KB
$ /usr/bin/time -f "CPU = %P, MEM = %M" my-command --threads 4 ...
CPU = 345%, MEM = 892341KB
$ /usr/bin/time -f "CPU = %P, MEM = %M" my-command --threads 8 ...
CPU = 605%, MEM = 936324KB
In this example, increasing the number of threads/CPUs to 4 did not result in a 4x increase in CPU usage, but only an 3.5x increase with 4 CPUs and only a 6x increase with 8 CPUs. This means that it would be more efficient to run two tasks with 4 CPUs in parallel, rather than running one task with 8 CPUs.
Live monitoring of processes in jobs
In addition to monitoring jobs at a high level, it is possible to
actively monitor the processes running in your jobs via (interactive)
shells running on the same node as the job you wish to monitor. This
allows us to estimate resource usage before a job has finished
running. In this example we will use the htop command to monitor our
jobs, but you can use basic top, a bash shell, or any other
command you prefer.
The first option for directly monitoring jobs is to request a job on the
same server using the --nodelist option to specify the node your job
is running on. However, this will not work if all resources on the node
are reserved, and for that reason we recommend running htop inside
your existing job.
This is done using the --overlap and --jobid command-line
options for srun, which tells Slurm that your new job should overlap
an existing job, and the ID of the job to overlap. The job ID can obtain
using for example the squeue --me command (from the JOBID
column), as shown here:
$ squeue --me
JOBID PARTITION     NAME     USER ST       TIME  NODES NODELIST(REASON)
 8503 standardq my_scrip   abc123  R       0:02      1 esrumcmpn03fl
$ srun --pty --overlap --jobid 8503 --gres=none htop
The --pty option gives us an interactive session, which allows us to
interact directly with htop. See the Interactive sessions
section for more information. The --gres=none option is required to
overlap jobs that reserve GPUs, since Slurm does not permit those to be
shared, even for overlapping jobs. See below for instructions on how to
monitor GPU utilization.
Monitoring GPU utilization
Monitoring of GPU utilization is highly recommended when you run jobs on the GPU node: To make full use of the hardware you want to keep GPU utilization at 100% and to do so you typically want to load as much data into GPU memory as possible. The exact way in which you can accomplish this depends on the software you are running, but can often be accomplished by increasing the size of the batches you are processing.
The way in which you are using the GPUs will affect how you can monitor them, depending on whether you have reserved a GPU for an interactive session:
Monitoring an interactive session
If you are running a job in an interactive session, then you can monitor the reserved GPU(s)
directly using the nvidia-smi command:
$ nvidia-smi -l 5
Thu Apr  4 14:30:46 2024
+---------------------------------------------------------------------------------------+
| NVIDIA-SMI 545.23.08              Driver Version: 545.23.08    CUDA Version: 12.3     |
|-----------------------------------------+----------------------+----------------------+
| GPU  Name                 Persistence-M | Bus-Id        Disp.A | Volatile Uncorr. ECC |
| Fan  Temp   Perf          Pwr:Usage/Cap |         Memory-Usage | GPU-Util  Compute M. |
|                                         |                      |               MIG M. |
|=========================================+======================+======================|
|   0  NVIDIA A100 80GB PCIe          On  | 00000000:27:00.0 Off |                    0 |
| N/A   57C    P0             307W / 300W |  52357MiB / 81920MiB |         99%  Default |
|                                         |                      |             Disabled |
+-----------------------------------------+----------------------+----------------------+
|   1  NVIDIA A100 80GB PCIe          On  | 00000000:A3:00.0 Off |                    0 |
| N/A   56C    P0             298W / 300W |  58893MiB / 81920MiB |        100%  Default |
|                                         |                      |             Disabled |
+-----------------------------------------+----------------------+----------------------+
+---------------------------------------------------------------------------------------+
| Processes:                                                                            |
|  GPU   GI   CI        PID   Type   Process name                            GPU Memory |
|        ID   ID                                                                 Usage  |
|=======================================================================================|
|    0   N/A  N/A   2807877  C   dorado                                        52344MiB |
|    1   N/A  N/A   2807849  C   dorado                                        58880MiB |
+---------------------------------------------------------------------------------------+
This will print resource usage for the GPUs you have reserved for your
interactive session (and only for those GPUs), and continue to print it
every 5 seconds afterwards via the -l 5 option. Other monitoring
tools are available (for example gpustat), but are outside the scope
of this documentation.
Monitoring a Slurm job
If you have started a standard (non-interactive) job via Slurm, then you
will not be able to directly run nvidia-smi nor will you be able to
join the running job using srun -j due to the way Slurm handles
special resources. We have therefore set up log-files on the GPU nodes
node that contains the output from the nvidia-smi command as shown
above.
To watch the content of this log-file, firstly determine the job ID of your job running on the GPU node:
$ squeue --me --partition=gpuqueue
 JOBID PARTITION     NAME     USER ST       TIME  NODES NODELIST(REASON)
570316  gpuqueue     bash   abc123  R      13:55      1 esrumgpun01fl
Then we use srun with the --overlap option to run a command
inside this job, which we specify using the --jobid 570316 option.
The --gres=none option is required, since otherwise Slurm would try
to reserve the GPU our job already uses and eventually time out.
$ srun --overlap --jobid 570316 --gres=none --pty -- watch -n 15 -d cat /scratch/gpus/nvidia-smi.txt
Warning
Remember to replace the 570316 with the ID of your job!
This prints the contents of the log-file every 15 seconds (which is how
often the files are updated) and optionally highlights the changes since
the last nvidia-smi run. To disable the highlighting, simply remove
the -d option from the command.
This command does not take up additional resources on the GPU node and will automatically exit when your job finishes. See the Live monitoring of processes in jobs for more information.
Monitoring the cluster
The slurmboard utility is made available as part of the cbmr_shared
project folder, in order to make it easy to monitor activity on the
cluster, for example to decide how many resources you can reasonably use
for a job (see Best practice for reserving resources):
$ module load slurmboard
$ slurmboard
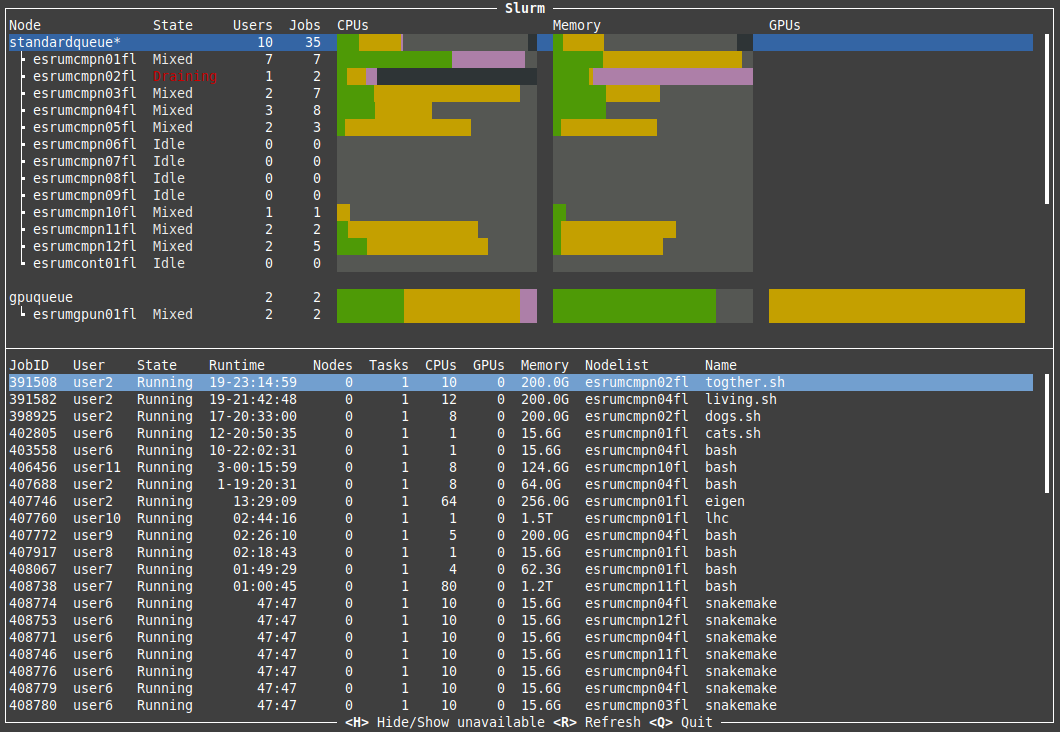
Briefly, this utility displays every node in the cluster, their status, and available resources for each of these. The resources (CPUs, Memory, and GPUs) columns are colored as follows:
Yellow indicates resources that have been reserved;
Green indicates resources that are actively being used;
Purple indicates resources that may be inaccessible due to other resources being reserved. This is based on the assumption that each job gets ~16 GB of RAM by default, and the resources may therefore still be usable for jobs with custom requirements.
Black indicates resources that are unavailable due to nodes being offline or under maintenance.
Note
The Data Analytics Platform uses this utility to monitor how busy the cluster is and how job are performing. In particular, we may reach out to you if we notice that your jobs consistently use significantly fewer resources than the amount reserved, in order to optimize resource utilization on the cluster.
Troubleshooting
Connection refused when running sacct / sacct-usage
If you attempt to run sacct or sacct-usage on any other node
than the head node, then you may get an error message like this:
sacct: error: slurm_persist_conn_open_without_init: failed to open persistent connection to host:localhost:6819: Connection refused
sacct: error: Sending PersistInit msg: Connection refused
sacct: error: Problem talking to the database: Connection refused
To avoid this, only run sacct and sacct-usage on the head node.